Using XDebug with VSCode on Ubuntu
A recent talk at Symfony Online guilt-tripped me out of the “var_dump() and die()” debugging style once again and back into using XDebug. It’s clearly the right solution to debugging in PHP and Derick is a good friend so I often feel guilty that I’ve fallen out of the habit. Coincidences being what they are, it really came in handy that I’d set it all up again when I had to diagnose a problem with one of our APIs this week. You can’t really var_dump() in a subrequest.
Here’s how I got it all working again on my Ubuntu / VSCode / Chrome setup.
Installation
| apt install php-xdebug |
Edit the configuration at /etc/php/$YOUR_VERSION_NUMBER/mods-available/xdebug.ini and add xdebug.mode=develop,debug at the bottom. I also like to increase var_display_max_depth and max_nesting_level (something like 1,000 is a good value when you’re working with frameworks), and enable cli_color.
Restart your web server to get it all working.
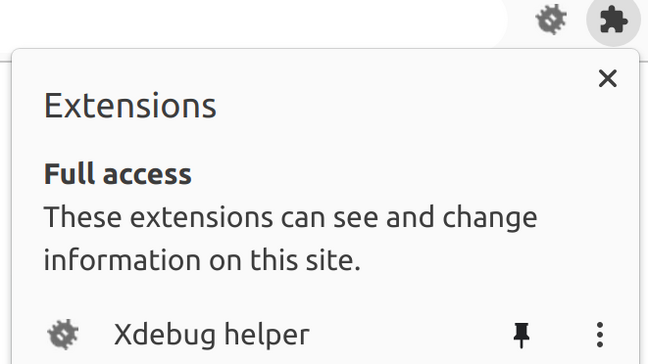
Install the Xdebug Helper for Chrome. Click on the extensions icon (the jigsaw piece top right after the address bar) and pin the extension to the taskbar. It looks like a bug, unsurprisingly.
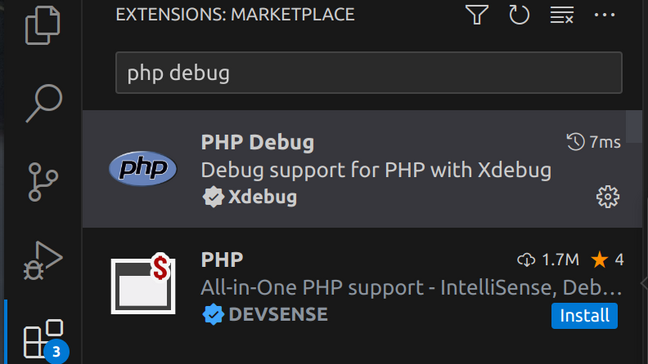
Open the “Extensions” tab on the left in VSCode or press Ctrl–Shift–X. Search for and install the PHP Debug extension.
Or use VSCode Quick Open (Ctrl–P) and run ext install xdebug.php-debug.
Open the “Run and Debug” tag on the left or press Ctrl–Shift–D. It’s unlikely your project has the appropriate customisation so you’ll probably see the message “To customize Run and Debug create a launch.json file.” Click the launch.json text and, if necessary, choose “PHP” from the list of language choices which will create you a default .vscode/launch.json in your current project.
Personally I don’t find “Launch currently open script” useful. I’m working with a framework, my current script doesn’t do anything on its own. And I don’t use the PHP built-in webserver, so the third option isn’t useful either. I remove both of these so my final launch.json looks like
{
    "version": "0.2.0",
    "configurations": [
        {
            "name": "Listen for Xdebug",
            "type": "php",
            "request": "launch",
            "port": 9003
        }
    ]
}
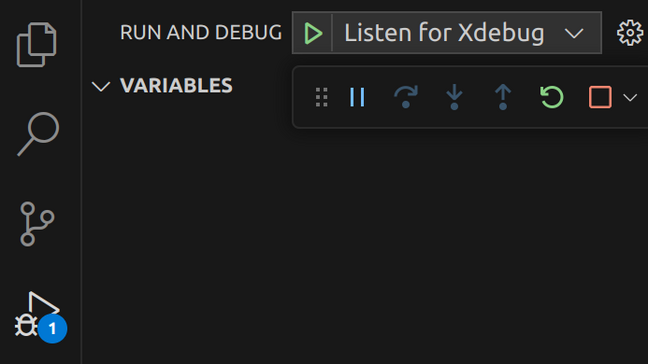
You should now see the variables, watch, and call stack sections in the left hand panel and a green play icon with “Listen for Xdebug” at the top of the screen. Click this button whenever you want to start the debugger.
Step debugging
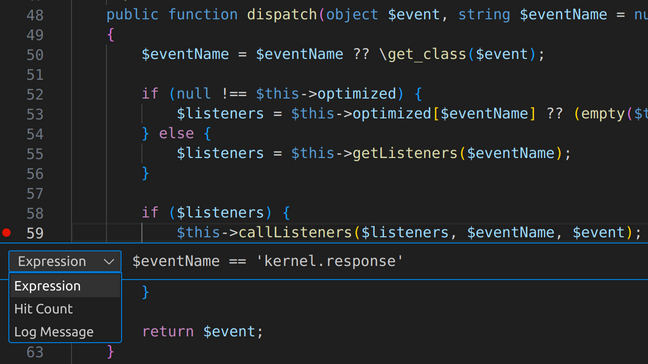
It’s now pretty straightforward to debug some code. Add a breakpoint by clicking in the left gutter next to the line numbers in a PHP file so that a red circle pops up. If you only want to break into the debugger if a variable is set to a particular value, right click and add a conditional breakpoint.
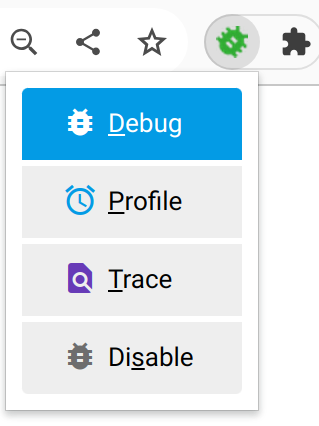
Return to your web browser and activate debug mode from the Xdebug helper menu, then refresh or load the page you want to debug.
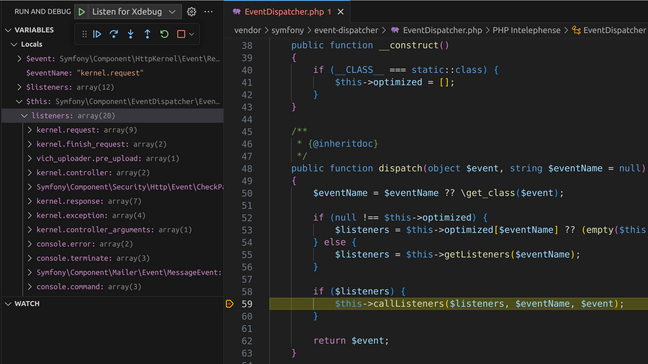
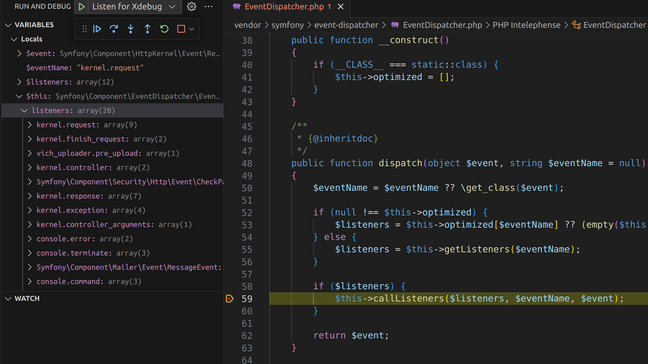
Once the running code reaches your breakpoint, and the expression is true, PHP will pause execution, VSCode will pop up at the line in question and show you the current variables in scope.
Use the toolbar buttons to step through code and work out what’s going on.
| Icon | Shortcut | Action |
|---|---|---|
| F5 | Stop debugging and execute the rest of the code. The request will complete and you’ll see the page load in your web browser. | |
| F10 | Step over to the next statement in the current function. In this case this would call all the listeners, and pause execution at line 62, return $event;. | |
| F11 | Step into the currently selected function call. Most useful for working out the detail of what’s going on. This will display the callListeners method definition and pause at the first statement. | |
| Shift–F11 | Step out of the current function and pause at the next statement after the calling statement. | |
| Ctrl–Shift–F5 | Slightly counterintuitively, this stops debugging but does not disconnect Xdebug. You’ll need to refresh the page in your web browser to actually restart debugging. | |
| Shift–F5 | Stop debugging and disconnect Xdebug. Press “Listen for Xdebug” again to start again. |
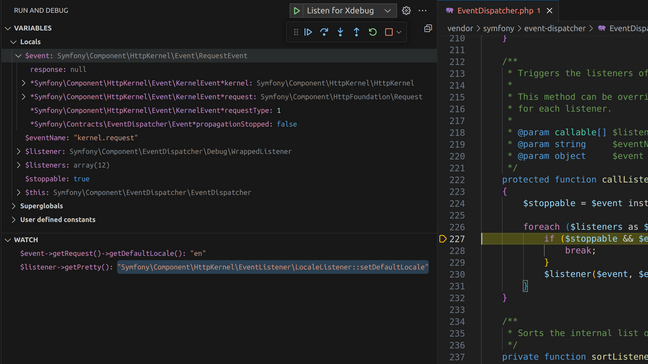
In this example we could well be trying to establish which event listener changes the default locale. In this case we’d want to step into the callListeners function, add watch expressions for the current listener and the current locale, and step over the foreach loop repeatedly until the watch conditions change. We had a very similar real world example this week trying to work out which template hook in a particular theme was breaking the display of media with text blocks.
You can step debug from the command line too. Just make sure your XDEBUG_SESSION environment variable is set. If you’re using BASH or Fish, running the following command should enable debugging for the whole of your current shell session.
export XDEBUG_SESSION=1 |
Everything else works in exactly the same way.
Error messages and those var_dump() calls
My colleague Gary reminded me it’s possible to add links to the URLs in Exception and error messages and the output of var_dump and the Symfony error handler.
The setting for this in /etc/php/$YOUR_VERSION_NUMBER/mods-available/xdebug.ini is xdebug.file_link_format="vscode://file/%f:%l" but, if you’re using Chrome, you’ll also need to allow these URLs without those annoying “Are you sure?” popups every time.
Edit /etc/opt/chrome/policies/managed/allow_vscode_protocol.json and add {"URLAllowlist": ["vscode:*"]}
Be careful with the capitalisation here. That’s a lower case “L”. Visit chrome://policy/ to check whether it worked.
All of this may feel a bit fiddly now, but it’s considerably more powerful and less error prone than the var_dump() and die() rut I seem to keep getting myself into. Must keep it up!